
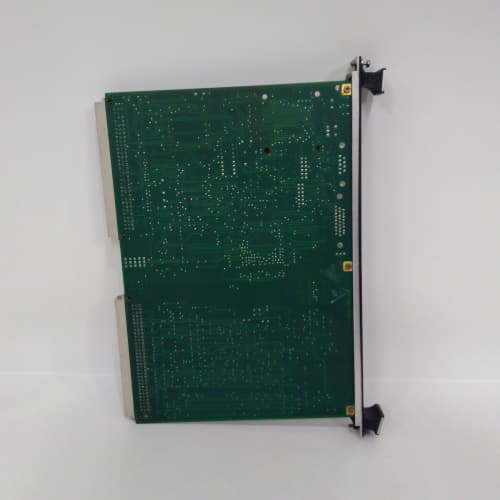
Description
Key Specifications
| Parameter | Specification |
|---|---|
| System Monitoring | Backplane voltage monitoring (+5 V, +3.3 V, ±12 V), temperature, processor status, memory usage, I/O bus integrity, instruction trace |
| Debug Interfaces | JTAG interface, RS-232 diagnostic port, Ethernet debug port |
| Data Logging | 10,000-event fault log with timestamps, diagnostic codes, instruction trace logs, and performance metrics |
| Communication | Dedicated debug Ethernet port, RS-232 console, JTAG for processor-level debugging |
| Indicators | Module health, system status, debug activity, trace capture active |
| Operating Temp | 0 °C to +60 °C |
| Power Draw | 5 W (+5 V / +3.3 VDC) |
| Connectors | Front-panel RS-232, RJ45 Ethernet debug port, JTAG header |
| Form Factor | 6U VME64x (160 × 233 mm), single-slot width |
| Diagnostic Memory | Non-volatile — retains logs through power cycles |
Advantages & Distinctive Features
-
Deep System Debug Access: JTAG interface for processor-level debugging—ideal for firmware development and advanced troubleshooting.
-
Instruction Trace Logging: Captures processor instruction flow—enables detailed post-event analysis for software faults.
-
Performance Metrics: Tracks processor load, memory usage, and I/O bus utilization.
-
10,000-Event Fault Log: Extensive logging capacity for comprehensive post-event analysis.
-
Dedicated Debug Ports: Separate Ethernet and RS-232 ports for debug access—does not interfere with plant communication networks.
-
Engineering Tool: Designed for system integrators, developers, and advanced maintenance personnel.
-
Hot-Swappable: Supports removal and replacement without powering down the rack.
-
Direct Retrofit: Replaces older JPDBG series boards.
Application Fields
-
Turbine Control Systems: Advanced troubleshooting and debugging
-
Firmware Development: Processor-level debugging
-
System Integration: Performance analysis and validation
-
Root-Cause Analysis: Instruction trace for software fault investigation
-
Engineering Laboratories: Development and test environments
Comparison with XDIAG and Competitors
| Feature | GE IS2020JPDBG01 | GE IS200XDIAG1ADD | Competitor A |
|---|---|---|---|
| JTAG Debug | Yes | No | No |
| Instruction Trace | Yes | No | No |
| Event Log | 10,000 events | 2000 events | No |
| Performance Metrics | Yes | Limited | No |
| Dedicated Debug Ports | Ethernet + RS-232 + JTAG | RS-232 only | No |
Selection Guidelines
-
When to choose:
-
Advanced troubleshooting requiring processor-level debug access
-
Firmware development and validation
-
Root-cause analysis of software faults
-
System performance analysis
-
-
When to choose XDIAG instead: For standard system health monitoring without debug capabilities.
-
Debug Connection: Use JTAG header for processor-level debugging; Ethernet/RS-232 for log access and monitoring.
-
Security: Dedicated debug ports should be disconnected during normal plant operation to prevent unauthorized access.
-
Compatibility: Fits all Mark VIe VME64x racks. Requires ControlST v7.0 or higher.
Operational Precautions
-
Security: Disconnect debug ports during normal operation—prevents unauthorized system access.
-
JTAG Handling: Use ESD-safe tools and procedures when connecting to JTAG header.
-
Event Log: Access via debug Ethernet port—do not connect to plant network.
-
Instruction Trace: Use sparingly—trace capture can impact processor performance.
-
Hot-Swap: Remove/insert slowly under power.
-
Spare Stock: Maintain 1 spare per 10–15 racks (engineering use only).
-
ESD: Handle by edges with grounded wrist strap.
-
Storage: Anti-static bag at –40 to +85 °C.
A-B 1786-RG6
A-B 1747-SDN
AB 1746-NI8
FUJIFILM SC-N12 220V 400A
Reviews
There are no reviews yet.